According to the Occupational Safety and Health Association (OSHA), incidents of worker injury, illness, and death have decreased significantly across all industries. Nonfatal workplace injuries and illnesses decreased by 5.7 percent between 2019 and 2020. Fatal work injury rate fell from 3.5 fatalities per 100,000 full-time equivalent (FTE) workers in 2019 to 3.4 in 2020. And with many people at home during the COVID-19 pandemic in 2020, the U.S. Bureau of Labor Statistics (BLS) reported fewer nonfatal injuries like trips, slips, and falls.
While improved workplace health and safety measures have led to a gradual decline in some of the most common work-related injuries and fatalities, the risks remain—especially for workers in industries with inherently more hazardous working conditions.
Throughout our years of providing Workers’ Compensation expertise and network to retail agencies nationwide, we’ve seen all manner of workplace risks. Here are 20 of the most dangerous jobs (beginning with the most hazardous):
- Fishing and hunting workers catch and trap various animals for several use cases, such as animal feed, human consumption, bait, and more. They often work under hazardous conditions while operating heavy machinery, weapons, and traps. Slips, falls, and drowning are just a few of the injuries these workers face.
Fatal injury rate: 132.1 per 100,000 workers.
- Loggers have a dangerous and physically demanding job, harvesting forests to supply raw materials for consumer goods and industrial products. Between working at treacherous heights, operating chainsaws, and facing the threat of falling trees, the risk of death for a logger is over 30 times higher than other U.S. workers.
Fatal injury rate: 91.7 per 100,000 workers.
- Roofers specialize in roof construction and maintenance. They typically use various materials to replace, install, and repair roofs. This physically demanding role requires a lot of climbing, kneeling, heavy-lifting, and bending—potentially resulting in slips or falls, tar burns, or even heat-related illnesses.
Fatal injury rate: 47 per 100,000 workers.
- Construction trade helpers assist experienced construction workers with cleaning up, supplying tools, carrying materials, and other labor needs. They’re subjected to many of the same working conditions and risks as their construction partners, including injuries from lifting materials and operating equipment.
Fatal injury rate: 43.3 per 100,000 workers.
- Aircraft pilots and flight engineers are often assigned long-distance routes that can lead to fatigue and jetlag, alongside the more obvious risks of transporting cargo or passengers. Some unique health risks to this job include insomnia, deep vein thrombosis, and dehydration. Strangely enough, pilots also experience high rates of skin cancer—though much is still unknown as to why.
Fatal injury rate: 34.3 per 100,000 workers.
- Refuse and recycling collectors have a daily routine filled with heavy-lifting, as well as operating trucks and other machinery. They are also repeatedly exposed to hazardous conditions, such as poorly disposed chemicals. One threat, in particular, is oncoming traffic during stops to collect trash.
Fatal injury rate: 33.1 per 100,000 workers.
- Structural iron and steelworkers run the risk of falls, slips, and trips. But in this profession, these incidents can be fatal due to the workers regularly climbing ladders, lifting, loading, and unloading heavy steel, and operating notchers, punch stations, and other machinery.
Fatal injury rate: 32.5 per 100,000 workers.
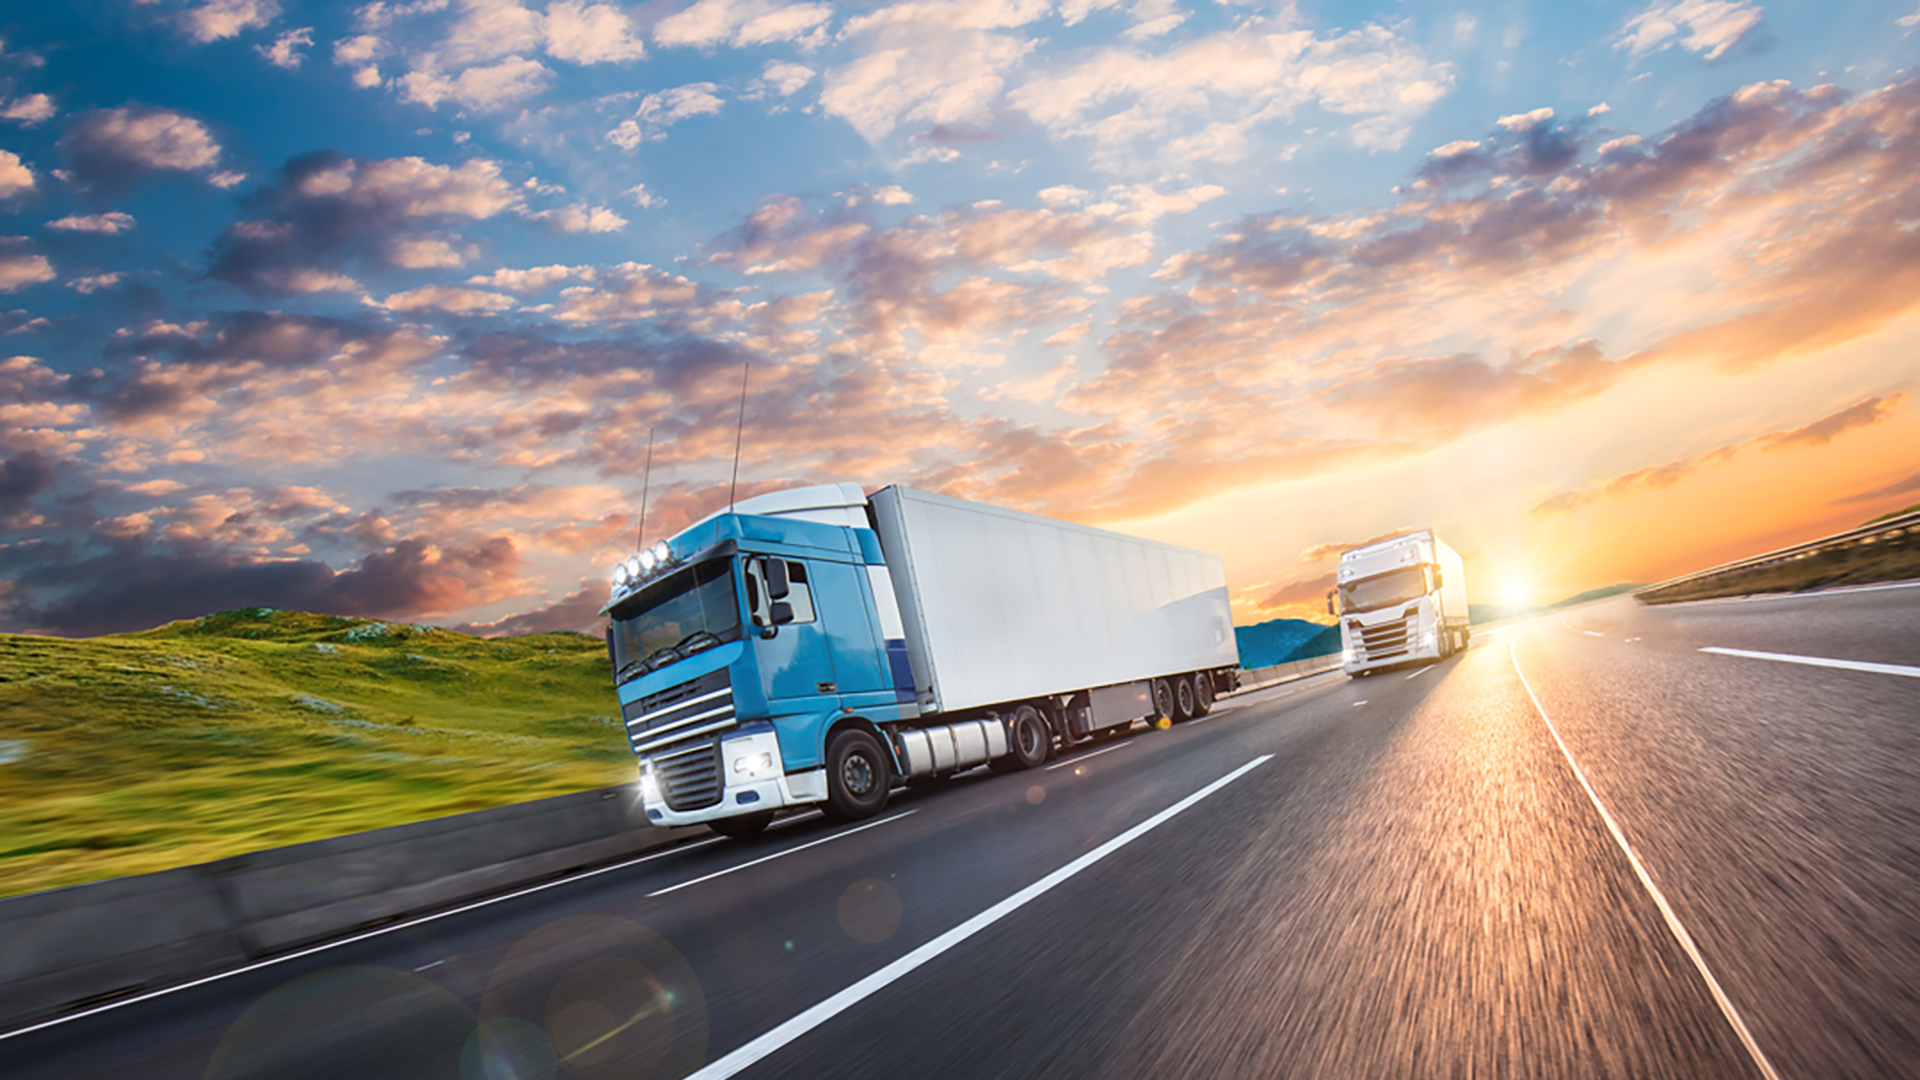
- Delivery and truck drivers travel long distances, loading, and unloading cargo. The sedentary lifestyle and long hours behind the wheel can lead to increased risks for obesity and back or neck injuries. Driving long-hauls with little or poor sleep can impair their driving and cause accidents.
Fatal injury rate: 25.8 per 100,000 workers.
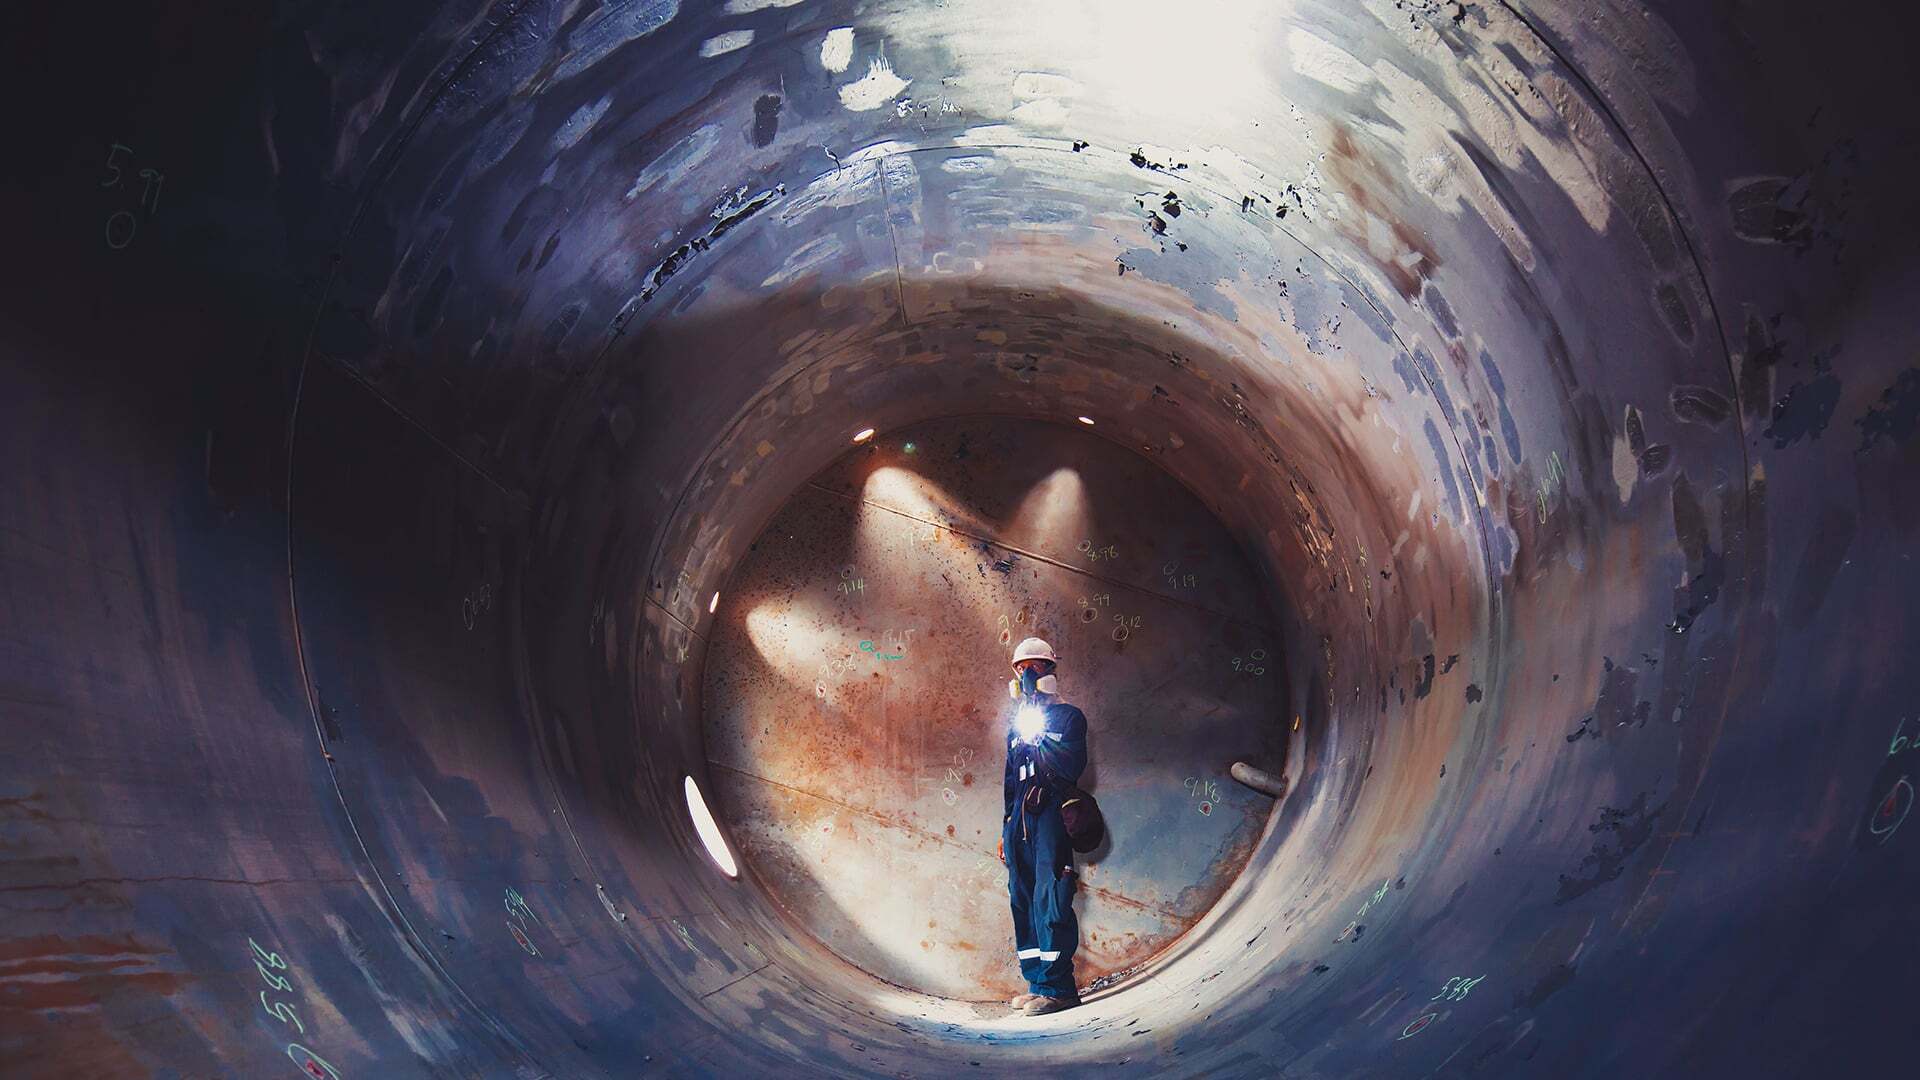
- Underground mining machine operators are constantly exposed to dangerous conditions as they work in mineral mines, quarries, and other locations. Accidents while using specialized machinery can lead to injuries and fatalities.
Fatal injury rate: 21.6 per 100,000 workers.
- Farmers, ranchers, and agricultural managers coordinate and plan the management and operation of farms, ranches, and other agricultural establishments. They also regularly operate dangerous machinery––tractor crashes are one of the most common causes of death in this line of work.
Fatal injury rate: 20.9 per 100,000 workers.
- Grounds maintenance workers are responsible for the upkeep of a property’s grounds, which often requires using power tools, lawnmowers, and other equipment that can lead to injuries.
Fatal injury rate: 19.4 per 100,000 workers.
- Electrical power-line installers and repairers install and repair cables and wires, which puts them at risk daily. Not only does the exposure to electricity and open wires pose a threat, but so does working at such great heights.
Fatal injury rate: 18.6 per 100,000 workers.
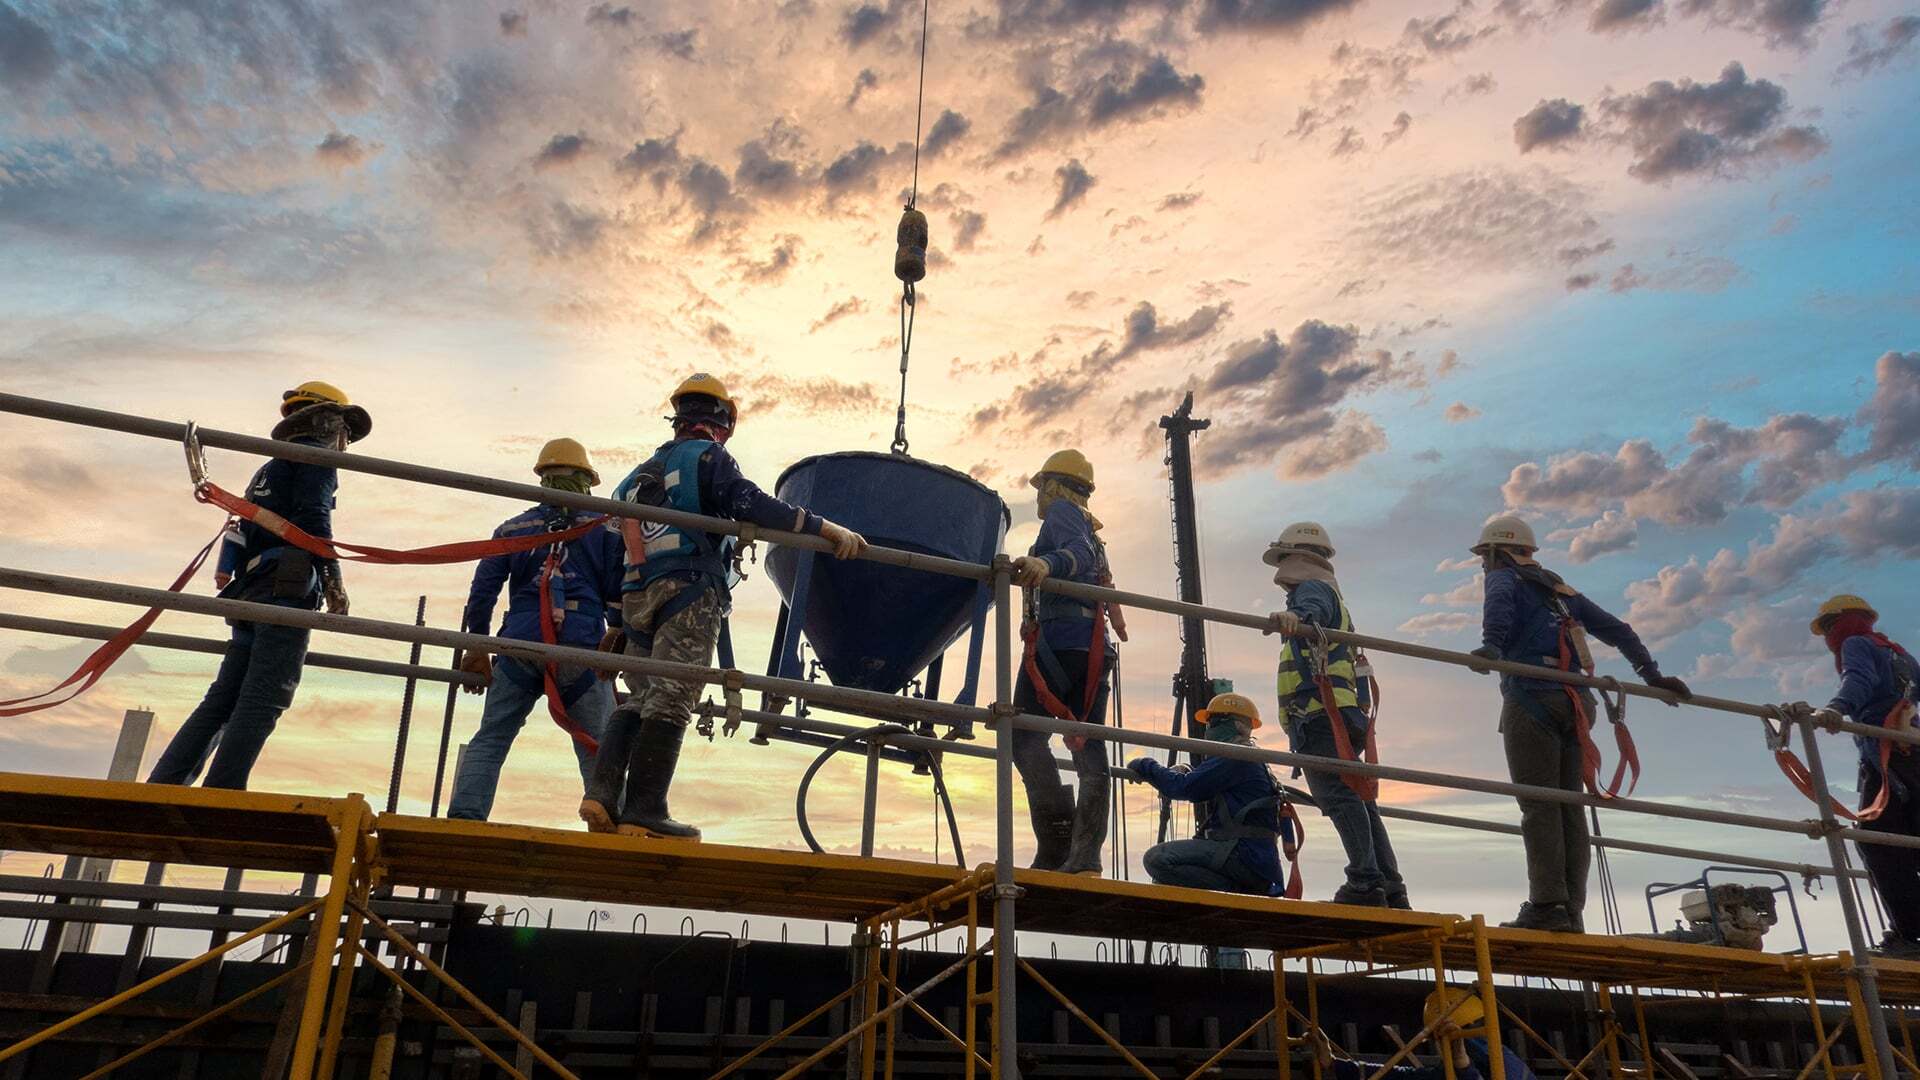
- Construction laborers perform various tasks on construction sites. They typically load and unload materials, operate machinery, dig trenches, construct scaffolding, build bracing, and more. This profession has some of the highest injury and illness rates caused by slips, falls, burns, and even exposure to harmful chemicals and fumes.
Fatal injury rate: 18.1 per 100,000 workers.
- Construction equipment operators maneuver, drive, and control machinery such as bulldozers, excavators, and backhoes to assist in the construction of buildings, roadways, and other structures. They may also clean and maintain equipment and make basic repairs. They can work in unpleasant weather and under hazardous conditions that can lead to falls, slips, trips, and other injuries.
Fatal injury rate: 17.6 per 100,000 workers.
- Miscellaneous agricultural workers include animal breeders, beekeepers, engineers, and other agricultural workers who work on farms and in various agriculture industries performing laborious tasks and sometimes operating machinery.
Fatal injury rate: 16.6 per 100,000 workers.
- First-line supervisors of landscaping, lawn service, and groundskeeping coordinate activities and supervise landscapers and groundskeepers, exposing them to many of the same risks as the individuals they’re responsible for.
Fatal injury rate: 15.3 per 100,000 workers.
- First-line supervisors of mechanics, installers, and repairers coordinate and supervise mechanics, installers, and repairers. They may also be responsible for operating machinery.
Fatal injury rate: 14.4 per 100,000 workers.
- Police officers work under dangerous conditions to maintain order, enforce laws, and protect lives and property. While dangerous individuals pose a threat, high-pressure situations, working irregular hours, and the physical strain and demands of the job also take a toll on their mental and physical health.
Fatal injury rate: 13.4 per 100,000 workers.
- General maintenance and repair workers’ duties include managing and repairing machines, buildings, and mechanical equipment. Their jobs require a lot of heavy lifting and climbing, which creates the potential for slips and falls.
Fatal injury rate: 12.3 per 100,000 workers.
- First-line supervisors of construction trades and extraction workers oversee and coordinate construction and extraction workers as they operate machines, build structures, and extract resources. While they may not be operating the equipment themselves, there’s always risk involved in working around such powerful tools.
Fatal injury rate: 11.7 per 100,000 workers.
Jencap’s team of experts provide tailored insurance solutions and market access to your clients for Workers’ Compensation. Contact us today to get started.

The Jencap Workers' Compensation Insurance Team
Workers’ compensation is not a generalist’s game. Jencap’s dedicated division of industry-leading workers’ compensation experts understands every facet of this
complex coverage line — from multi-state operations and high-hazard risks to United States Longshore and Harbor Workers Compensation Act (USL&H), and everything in between. No matter your clients’ industry, state, experience modification factor, premium size, or class code, the Jencap workers' compensation team has you covered.